32 Small Business Statistics to Capitalize on in 2024

While not particularly an easy feat, starting a business enables you to quit your full-time job and achieve financial independence.
Before entering the small business world, however, it’s a good idea to research the most profitable online business ideas and understand the market’s current state.
By doing so, you can choose an industry with the most potential and learn from the mistakes of other business owners.
In this article, we’ve compiled the latest small business statistics that you should know to build a successful venture in 2024.
Download checklist: How to start an online business
Top 10 Small Business Stats You Should Know
- There are 33.2 million small businesses in the US, comprising 99% of all firms.
- Small businesses contributed to 17.3 million new jobs created over the last 26 years.
- The costs of starting a business were between $250,000 to $500,000 for most entrepreneurs.
- A self-employed business owner typically makes $44,000/year, while companies with one to four employees generate around $387,000/year.
- Rollovers for Business Startups (ROBS) was the most popular form of financing in 2023.
- Most people (28%) started a small business to be their own boss. Only 13% did so to pursue their passion.
- The average income of a small business owner in the US is $69,119/year.
- Nine out of ten consumers read online reviews before making a purchase.
- Within the first year, almost 22% of small businesses fail. By the fifth year, the number increases to 50%.
- Most small businesses fail due to cash flow problems and a lack of demand for their product or service.
Keep reading to learn more about current small business trends and statistics.
General Small Business Statistics
This section focuses on small business facts in the US. Therefore, the data should benefit those living in the US or planning to make money online by targeting this particular market.
1. There Are Around 33.2 Million Small Businesses Operating in the US
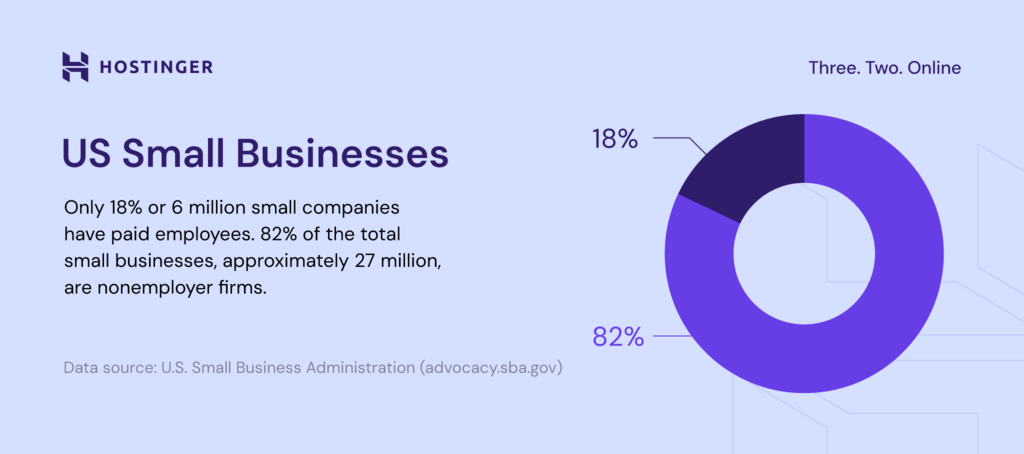
Nonemployer firms account for 82% (about 27 million) of all small businesses in the US. This business model is highly popular because it offers more autonomy and requires low startup capital.
Only around 6 million (18%) of them have at least one employee on their payroll, also known as small employer businesses.
2. Small Businesses in the US Comprise 99.9% of All Firms
While Fortune 500 companies get all the attention, small businesses are the real driving force behind US economic growth.
Representing a huge chunk of all American enterprises, the collective success or failure of small businesses can have a massive impact nationwide. For policymakers, it signals the need to create supportive regulations to ensure high survival chances among small firms.
3. Small Businesses Created 17.3 Million Net Jobs in 26 Years
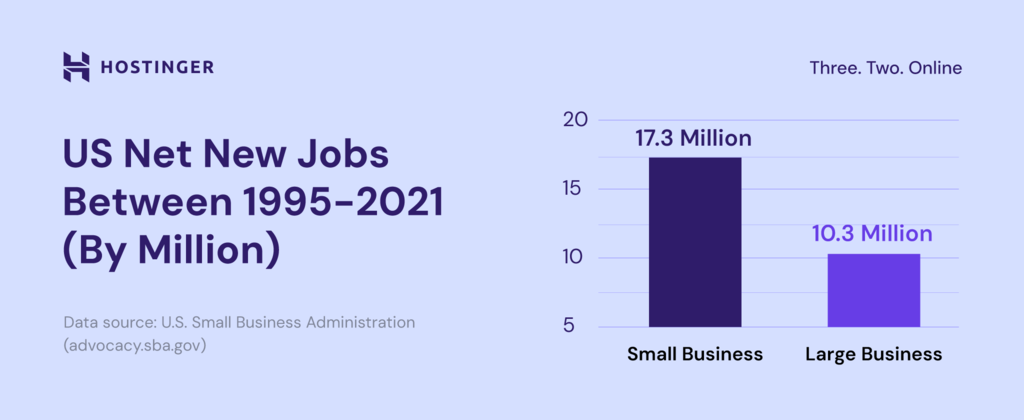
Reducing the unemployment rate is another important role of small companies.
According to the US Bureau of Labor Statistics, small businesses created 17.3 million new jobs from 1995 to 2021. In comparison, large enterprises generated 6.7 million new jobs within the same period.
4. Small Businesses Employ 61.7 Million Americans
Despite making up only 18% of the total small enterprises in the US, small employer businesses still manage to employ 61.7 million Americans. That’s nearly half of the workforce (46.4%) in the private sector alone.
This statistic once again shows the importance of small businesses in driving the country’s financial growth and stability.
5. Franchisees Constitute 46% of Small Business Owners
Franchising has gained massive popularity over the last few years, as it offers a proven business model, an established brand identity, and a loyal customer base. In fact, compared to the previous year, the number of franchisees grew by approximately 12% in 2023.
A recent survey suggested that 46% of small business owners are franchisees who either start a new franchise location (35%) or purchase an existing business (11%).
6. Professional Services and Real Estate Dominate the Small Employer Business Landscape
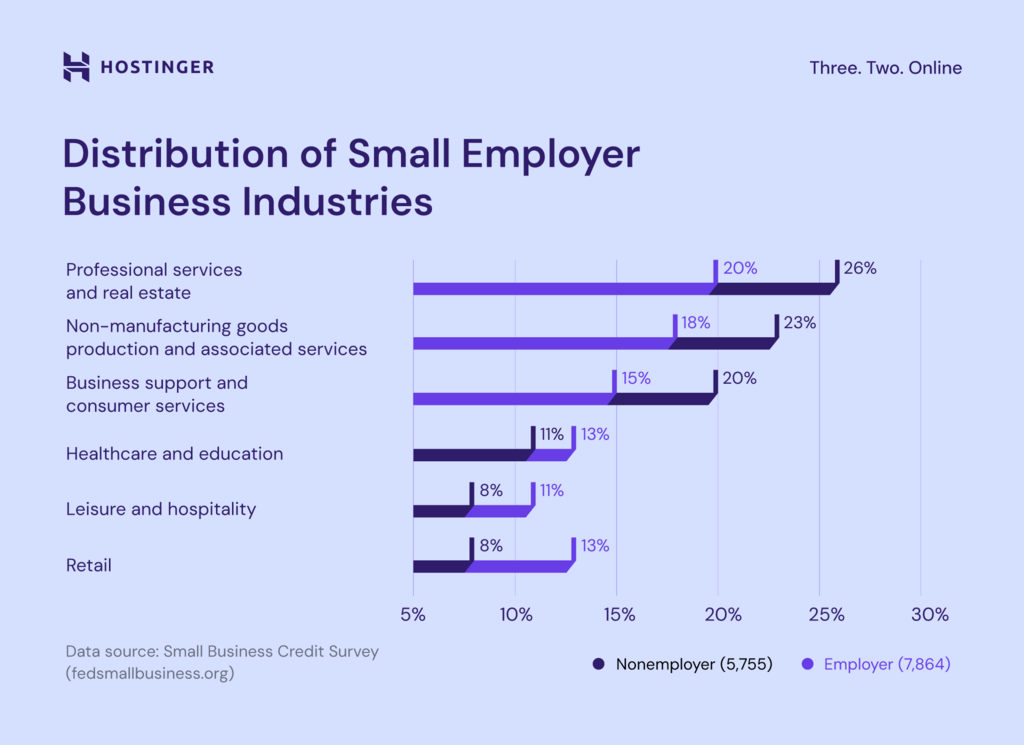
20% of US-based employer businesses operate within the professional services and real estate industries.
Non-manufacturing goods production and associated services have the second-highest share of small employer firms at 18%. Business support and customer services come third with 15%.
Furthermore, industries like retail and hospitality have the least amount of small employer firms, accounting for 13% and 11%, respectively.
In other words, you will have a better chance of survival when opening a retail business, compared to more saturated sectors like real estate.
7. More Than Half of Small Employer Firms Are S Corporations
52.4% of small employer firms in the US are S corporations.
An S corporation has a special tax status that includes the business profit in the shareholders’ income tax. It’s designed to avoid C corporations’ double taxation and protect the owners’ assets from business debts.
| Type of Business | Nonemployer | Small employer |
| Sole proprietorship | 86.5% | 13.3% |
| Partnership | 7.4% | 12.2% |
| S corporation | 4.6% | 52.4% |
| C corporation & others | 1.6% | 22.3% |
On the other hand, the sole proprietorship structure is popular among nonemployer firms (86.5%). Its simple legal requirements make it easy for anyone to start a business, as only one person owns and runs it.
Small Business Social Media Marketing Stats
As of April 2024, there were over five billion social media users worldwide. Due to its large user base, it comes as no surprise that many small businesses rely on social media to promote their brand.
In this section, we’ll reveal some important statistics that will help you plan the right business strategy to dominate social platforms.
8. Facebook and YouTube Are the Most Popular Social Networking Platforms
Facebook and YouTube are among the most visited websites globally, with over 32 billion and 16 billion monthly users, respectively. Instagram and X (formerly Twitter) come next, generating more than 6 billion monthly visitors each.
Keep in mind that each platform has its unique set of user demographics, so tailor your digital marketing strategy accordingly. Given that a significant portion of millennials place more trust in recommendations from influencers over traditional advertisements, it’s crucial to integrate influencer partnerships into your approach. For more insights on this trend, you can refer to these digital marketing statistics.
9. Most Businesses Post on Social Media Monthly
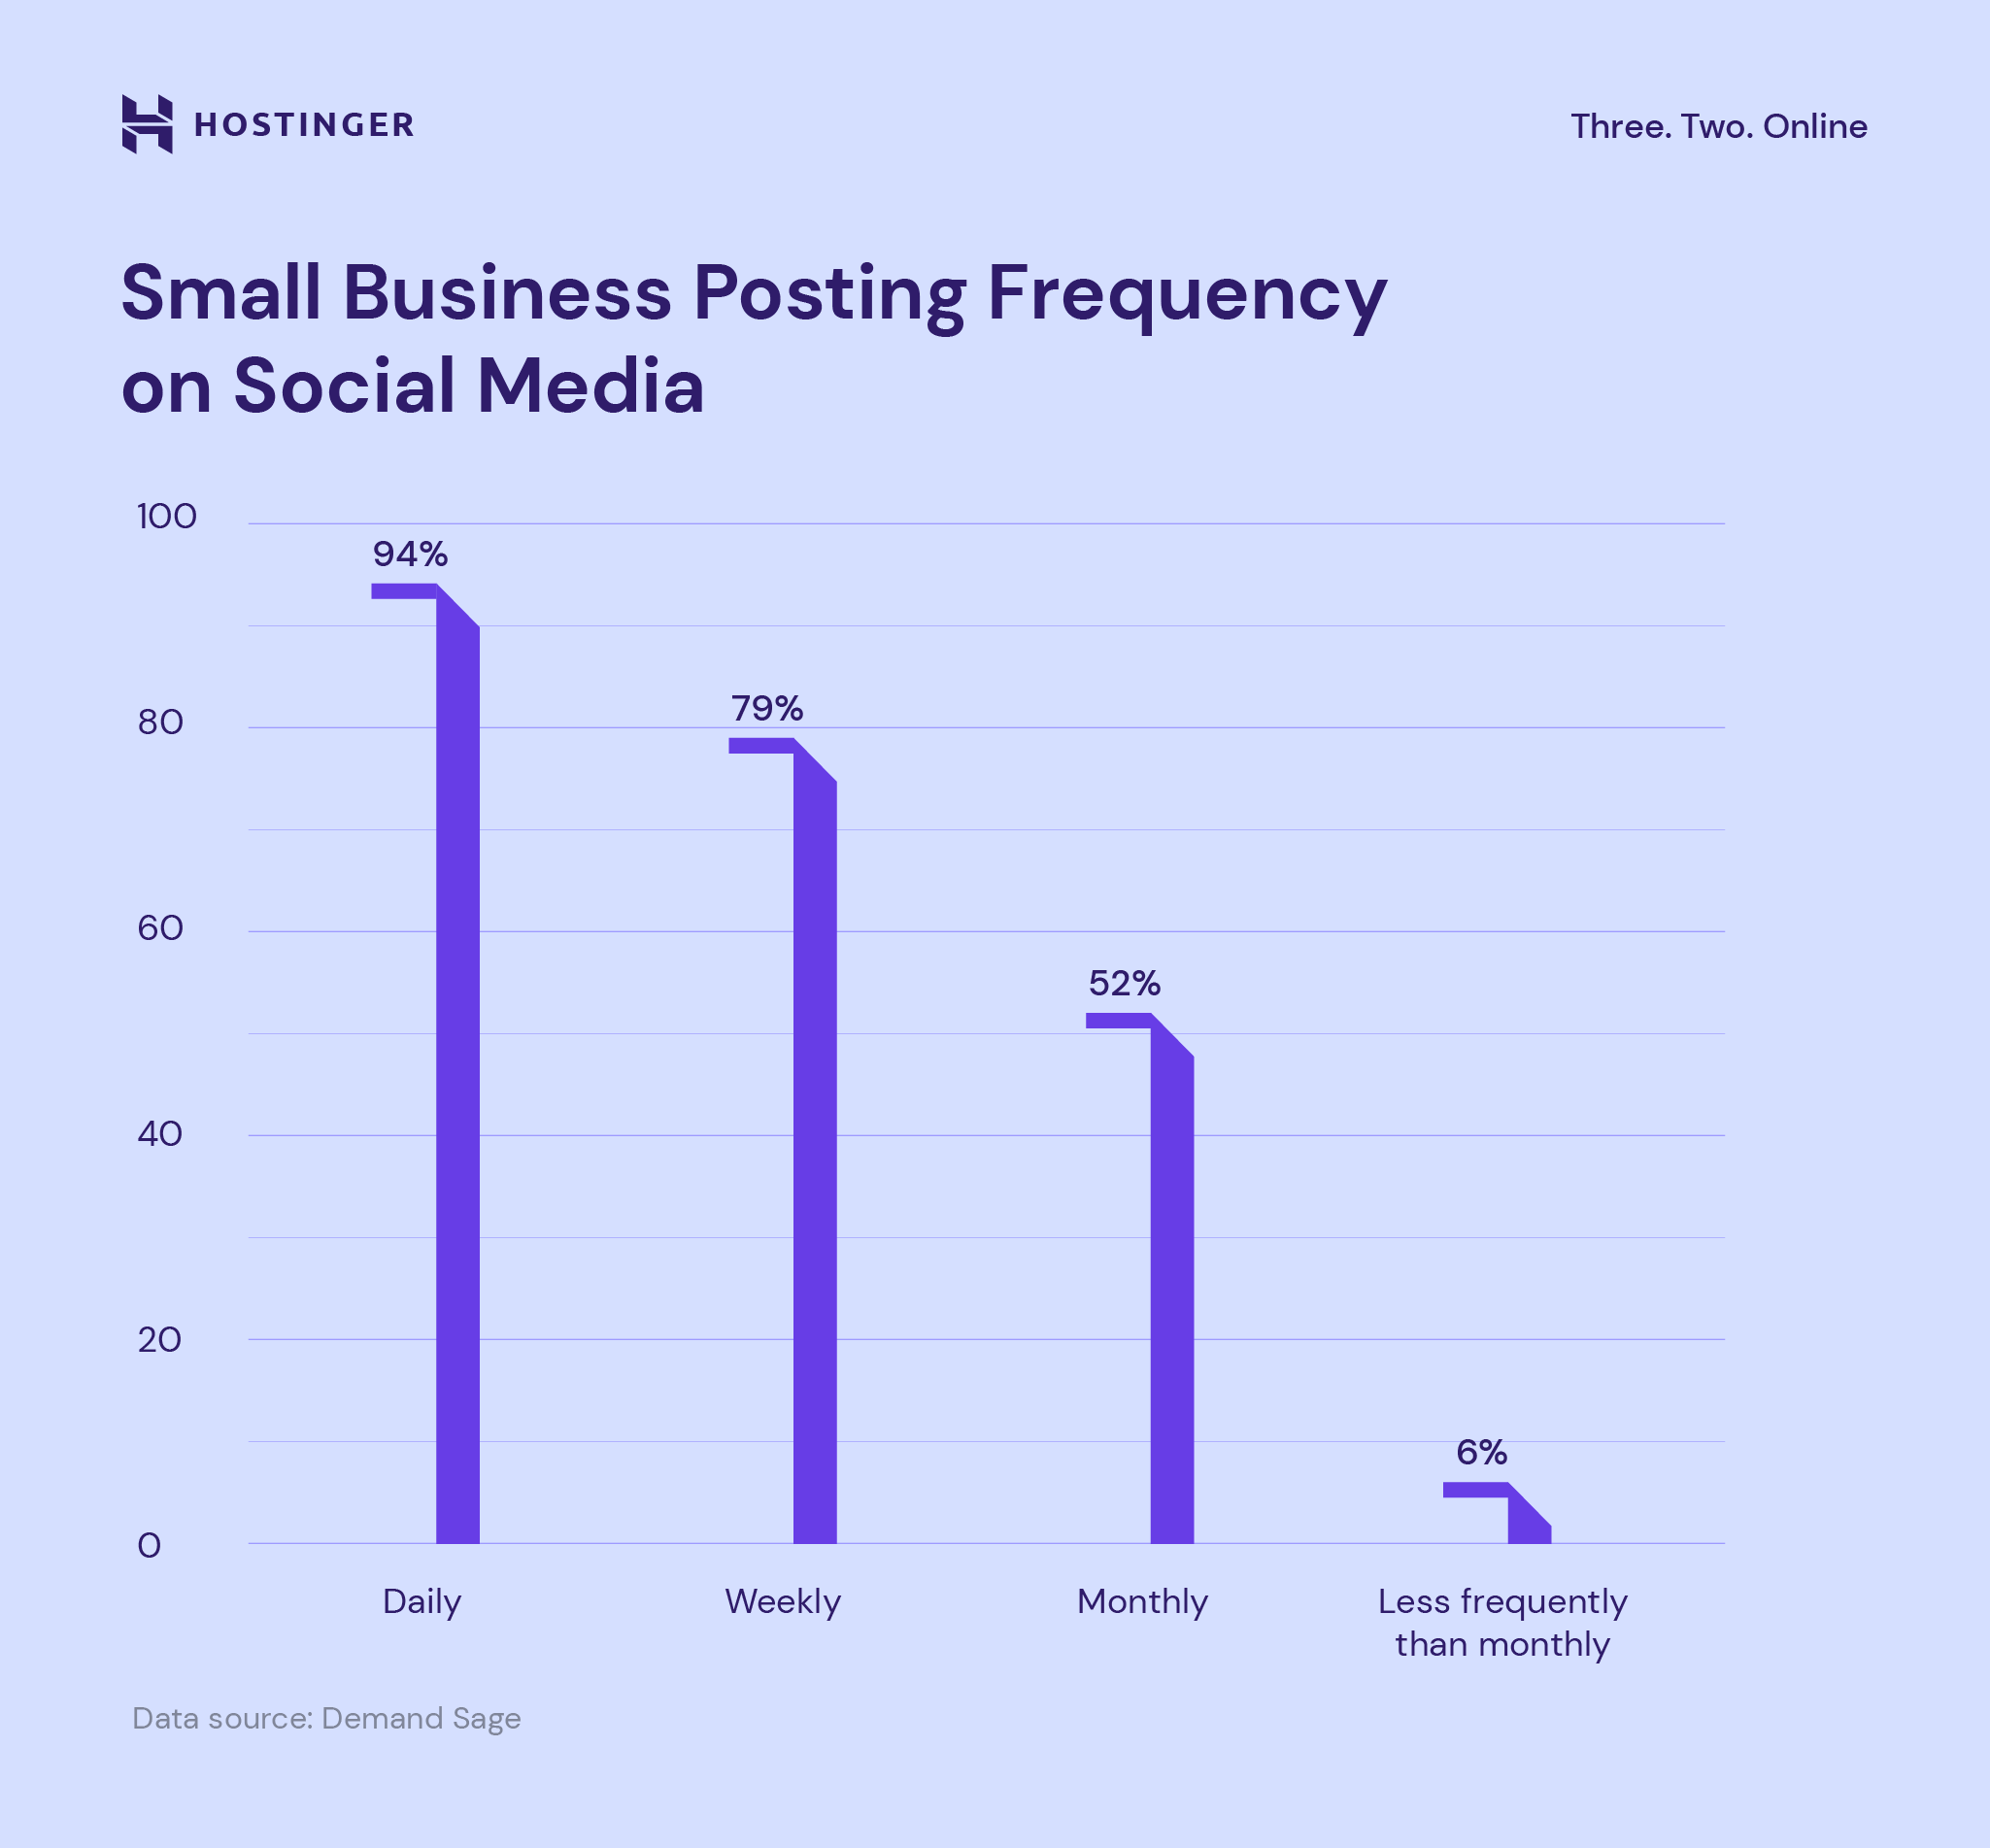
94% of small businesses post monthly, 79% post weekly, and 52% post daily on social networking sites. Only 6% of small companies post less than once a month.
Interestingly, 37% of social media users prefer brands that engage with their audiences directly, rather than posting a lot of content pieces.
10. 30% of Users Expect Brands to Respond on the Same Day
To build a considerable following on social media, engagement is key. This is because the vast majority (76%) of users value brands that offer fast-responding customer support.
When it comes to customers’ complaints on social media, 30% of them expect you to respond on the same day, 23% prefer receiving answers in two hours at the least, and 16% demand solutions within minutes.
Small Business Finance Statistics
Let’s find out how small firms manage their financial affairs. In this section, we will go over five small business statistics that will help you make better financial decisions.
11. The Startup Costs for Most Small Businesses Range From $250-500K
For around 27% of entrepreneurs, the costs of starting a business were between $250,000 to $500,000. 16% of them even invested $500,000 to $1 million in startup expenses.
Only 3% of small business owners required less than $50,000 when launching their venture for the first time.
12. The Average Amount of Small Business Loans Is $538K
Most small businesses take loans from the US Small Business Administration (SBA), with SBA 7(a) loans being the most popular.
In 2022, the average SBA 7(a) loan was $538,903. Meanwhile, the average SBA Express loan was $97,097 during the same period. This loan type gives you access to faster funding, but it has a cap of $500,000.
13. Most Startups Used Their Own Funds to Launch the Business
Bootstrapping has become a norm in the startup scene, as 78% of entrepreneurs launched and grew a small business without external help. They relied on personal funding and income from another job to get the startup up and running.
Depending on the industry and business type, 42% of small businesses started with less than $5,000 in cash reserves, while 24% needed $50,000 or more.
14. The Average Small Business Revenue Increases as the Number of Employees Rises
The average annual revenue of a self-employed business is $44,000. For employer businesses, the amount is closely tied to the number of workforce – more employees mean more revenue.
For instance, companies with one to four employees make around $387,000/year, while businesses with five to nine employees generate at least $1 million in annual revenue.
Unfortunately, only 40% of small businesses were profitable at some point in their existence. 30% of them managed to break even, while the remaining 30% suffered a revenue loss.
15. Small Businesses Have a 57% Loan Approval Rate
Small business loans have a 57% approval rate. However, each approval will depend on many factors, such as the bank type and the applicant’s location, race, and gender.
Small businesses in rural areas have a higher approval rate (51%) when compared to urban companies (38%). This is because businesses in big cities tend to favor large banks, despite offering lower approval rates than small lenders.
16. Labor Remains the Largest Expense for Small Businesses
Companies spend 70% of their operating expenses on employee wages and bonuses. For this reason, a high percentage of small businesses perform mass layoffs or hire freelancers when facing financial challenges.
Stock inventory is the second biggest source of spending, accounting for 17-25% of a company’s total budget.
To reduce costs, some startups cut down on office leases by going fully remote, while others seek suppliers or manufacturers who offer more affordable contracts.
17. ROBS Is the Most Popular Form of Business Financing
In 2023, Rollovers for Business Startups (ROBS) was the most popular form of financing, with 52% of business owners utilizing it.
19% of small businesses preferred cash, while 12% sought financial aid from Small Business Administration (SBA) loans. The least popular financing methods include lines of credit (LOC) and unsecured loan terms, accounting for only 3% each.
Small Business Owners Statistics
Learning about small business owner demographics will offer more insights into competitors. Plus, this information can help you learn from their mistakes and create a better business and marketing strategy.
18. Only 12.9% of Business Owners Are Millennials
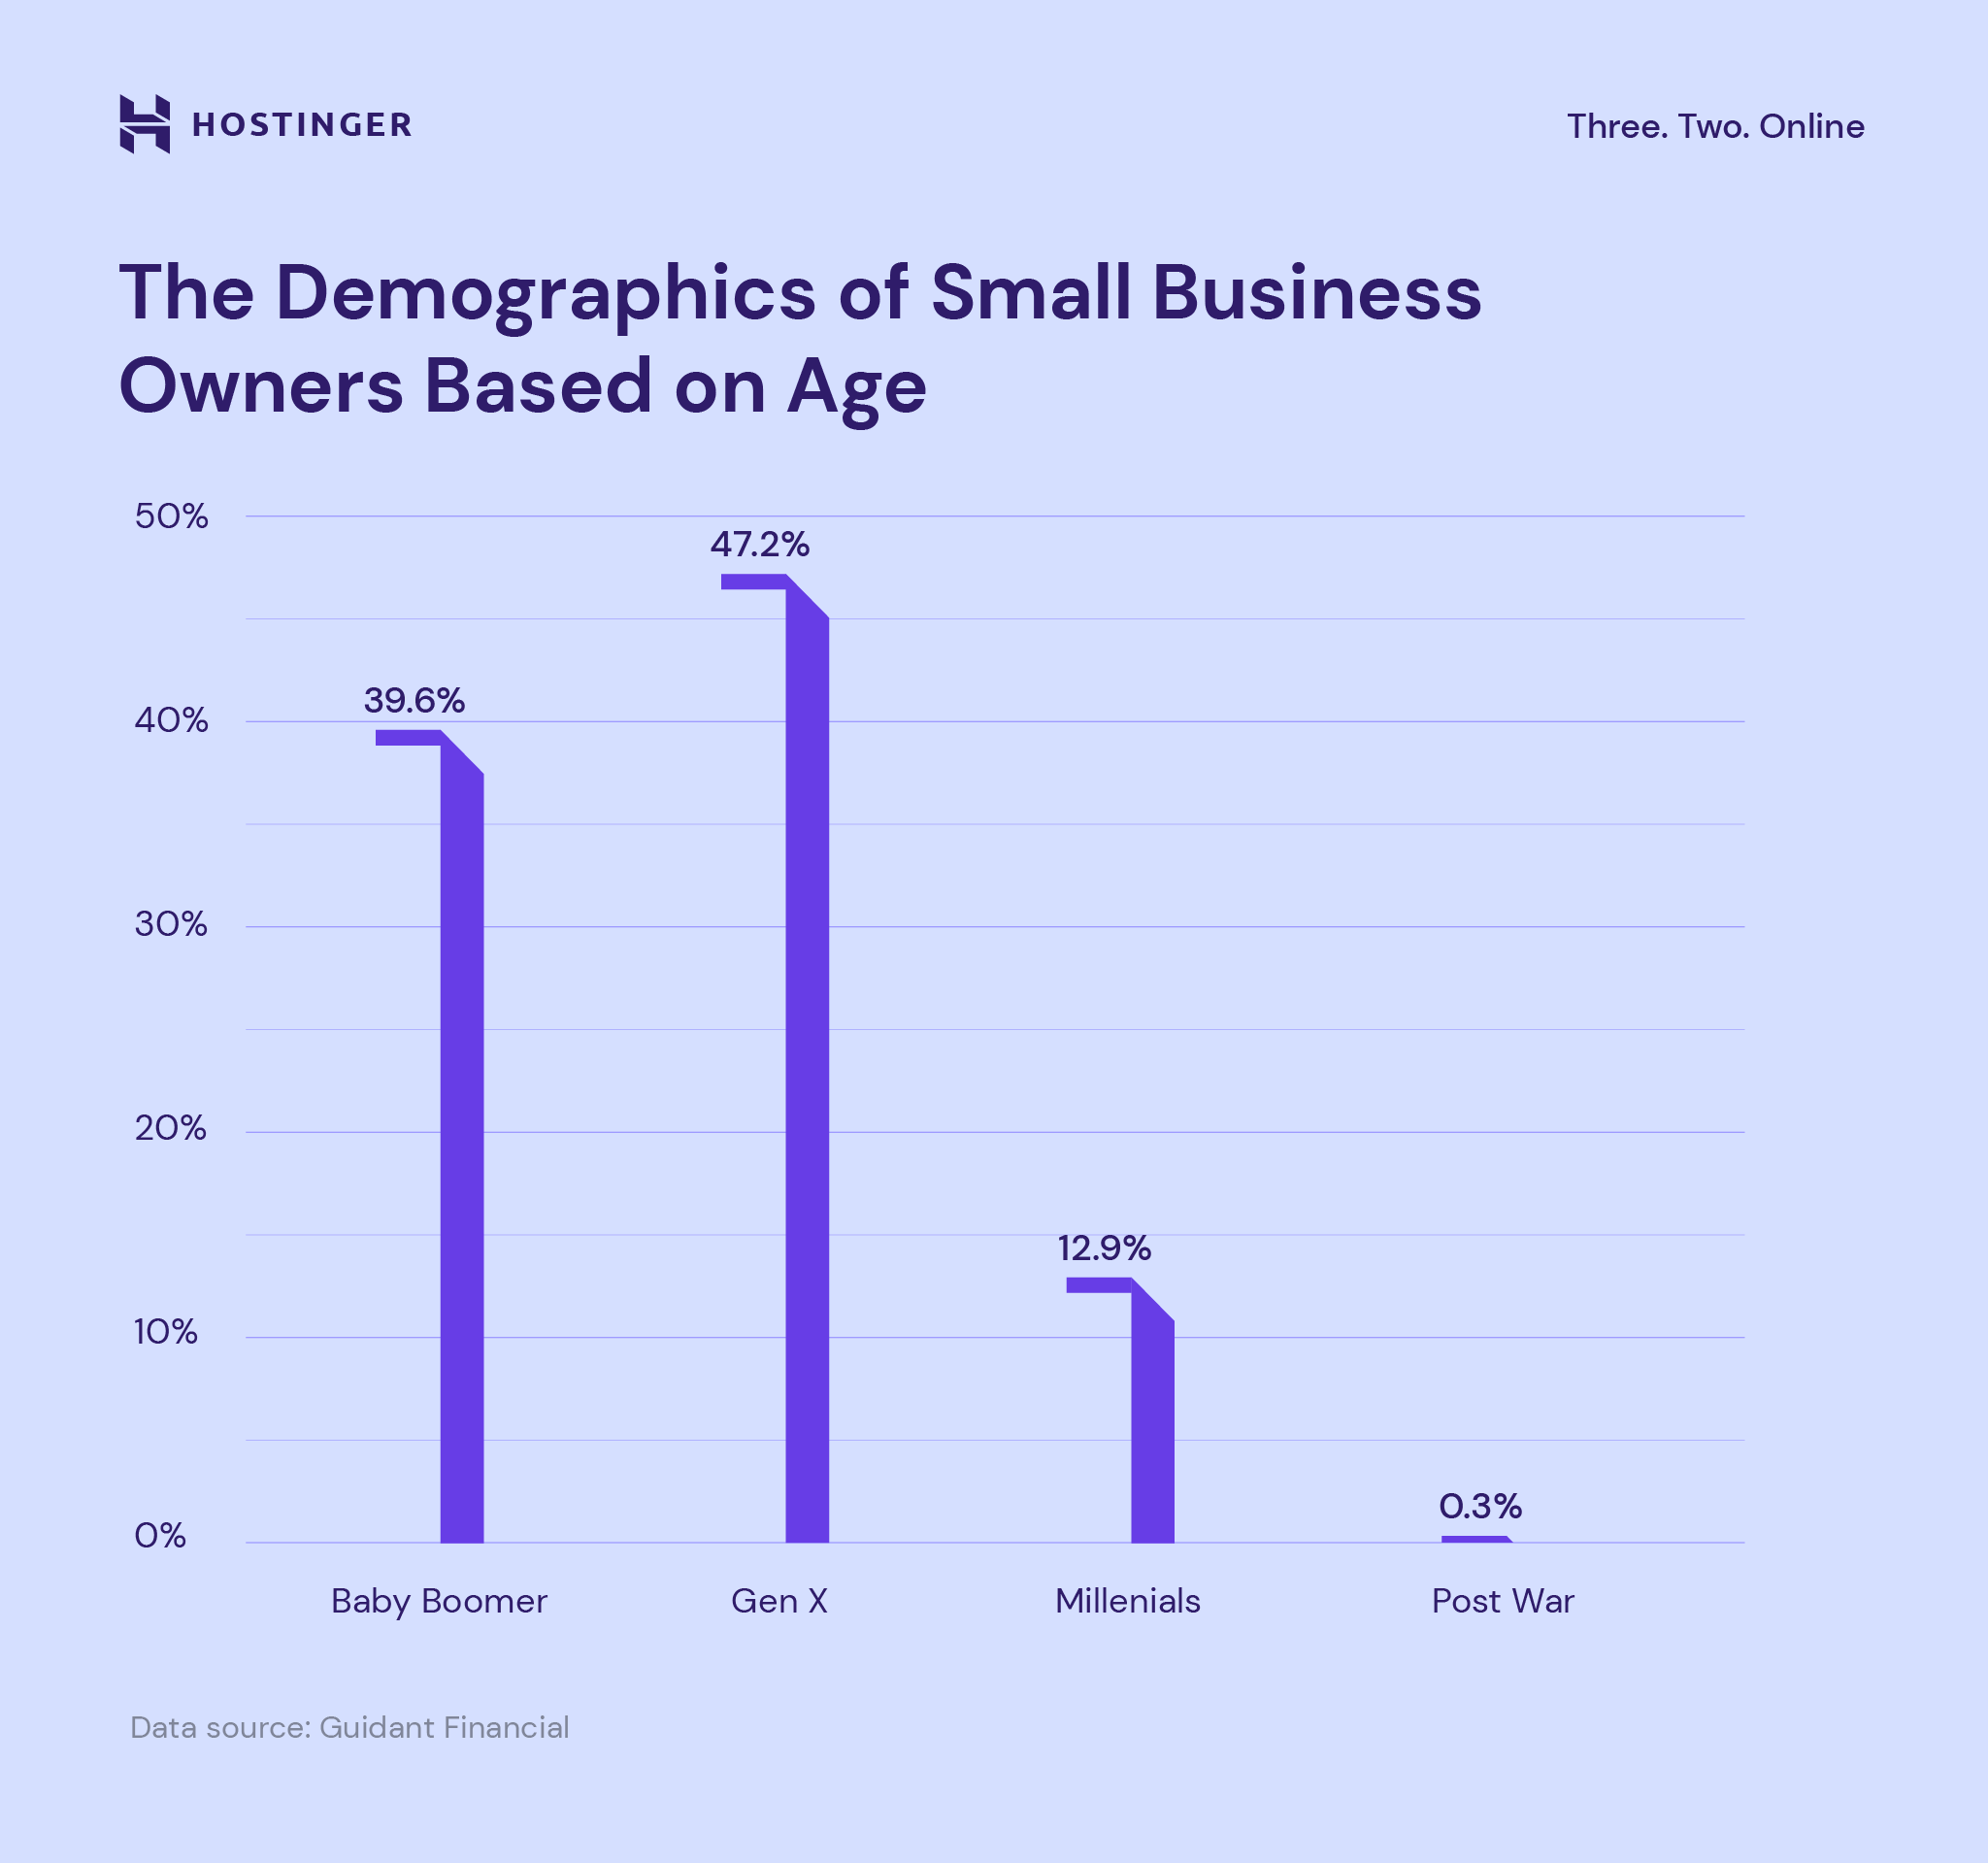
47.2% of small business owners are Gen X, 39.6% are baby boomers, and 12.9% are millennials. The silent generation – born between 1928-1946 – only accounts for 0.25% of all small business owners.
This business trend shows a shift in small business ownership from baby boomers to Gen X. One of the reasons is that many baby boomers entered retirement in 2022, whereas Gen Xers are still in their productive years.
19. 43.4% of All Small Businesses Are Women-Owned Firms
Based on the latest business growth statistics, women-owned businesses saw a 17.6% increase from 2012 to 2019, outpacing their male counterparts by a long mile (5.2%).
Today, women own 43.4% of small businesses in the US: 55.7% are Gen X, 29.9% are baby boomers, and 14.4% are millennials.
Sector-wise, 26% of women entrepreneurs own a retail company, while 17% operate in the healthcare industry. Other sectors include food and restaurant (14%), lodging (7%), and education (6%).
20. The Desire for Autonomy Motivates People to Start a Business

28% of people started a small business because they wanted to be their own boss. In addition, 23% of entrepreneurs felt dissatisfied with corporate America. This means that the freedom to schedule your own time and follow your own rules is the main reason for starting a business.
Surprisingly, only 13% of the respondents own businesses to pursue their passion. Don’t worry if you don’t have to have a hobby or extraordinary passion – you can still become a successful entrepreneur.
In addition, 10% of respondents built a company after being laid off, another 10% weren’t ready to retire, and 9% did so because there was an opportunity.
21. The Average Annual Pay For a Small Business Owner Is $63K in 2024
Small business owners work nights and weekends to meet the market demand.
And it pays off. The average small business owner in the US makes around $69,111/year, with the annual base salary ranging between $32,000-$147,000.
On average, entry-level small business owners with less than one year of experience earn about $34,000/year. Those with 1-4 years of experience generally make around $53,000/year.
Meanwhile, mid and late-career small business owners with 5-19 years of experience are estimated to earn $63,000-$73,000/year. Finally, seasoned entrepreneurs with 20 years of experience or more make around $75,000/year on average.
22. The Number of Small Businesses Owned by Minorities Keeps Growing
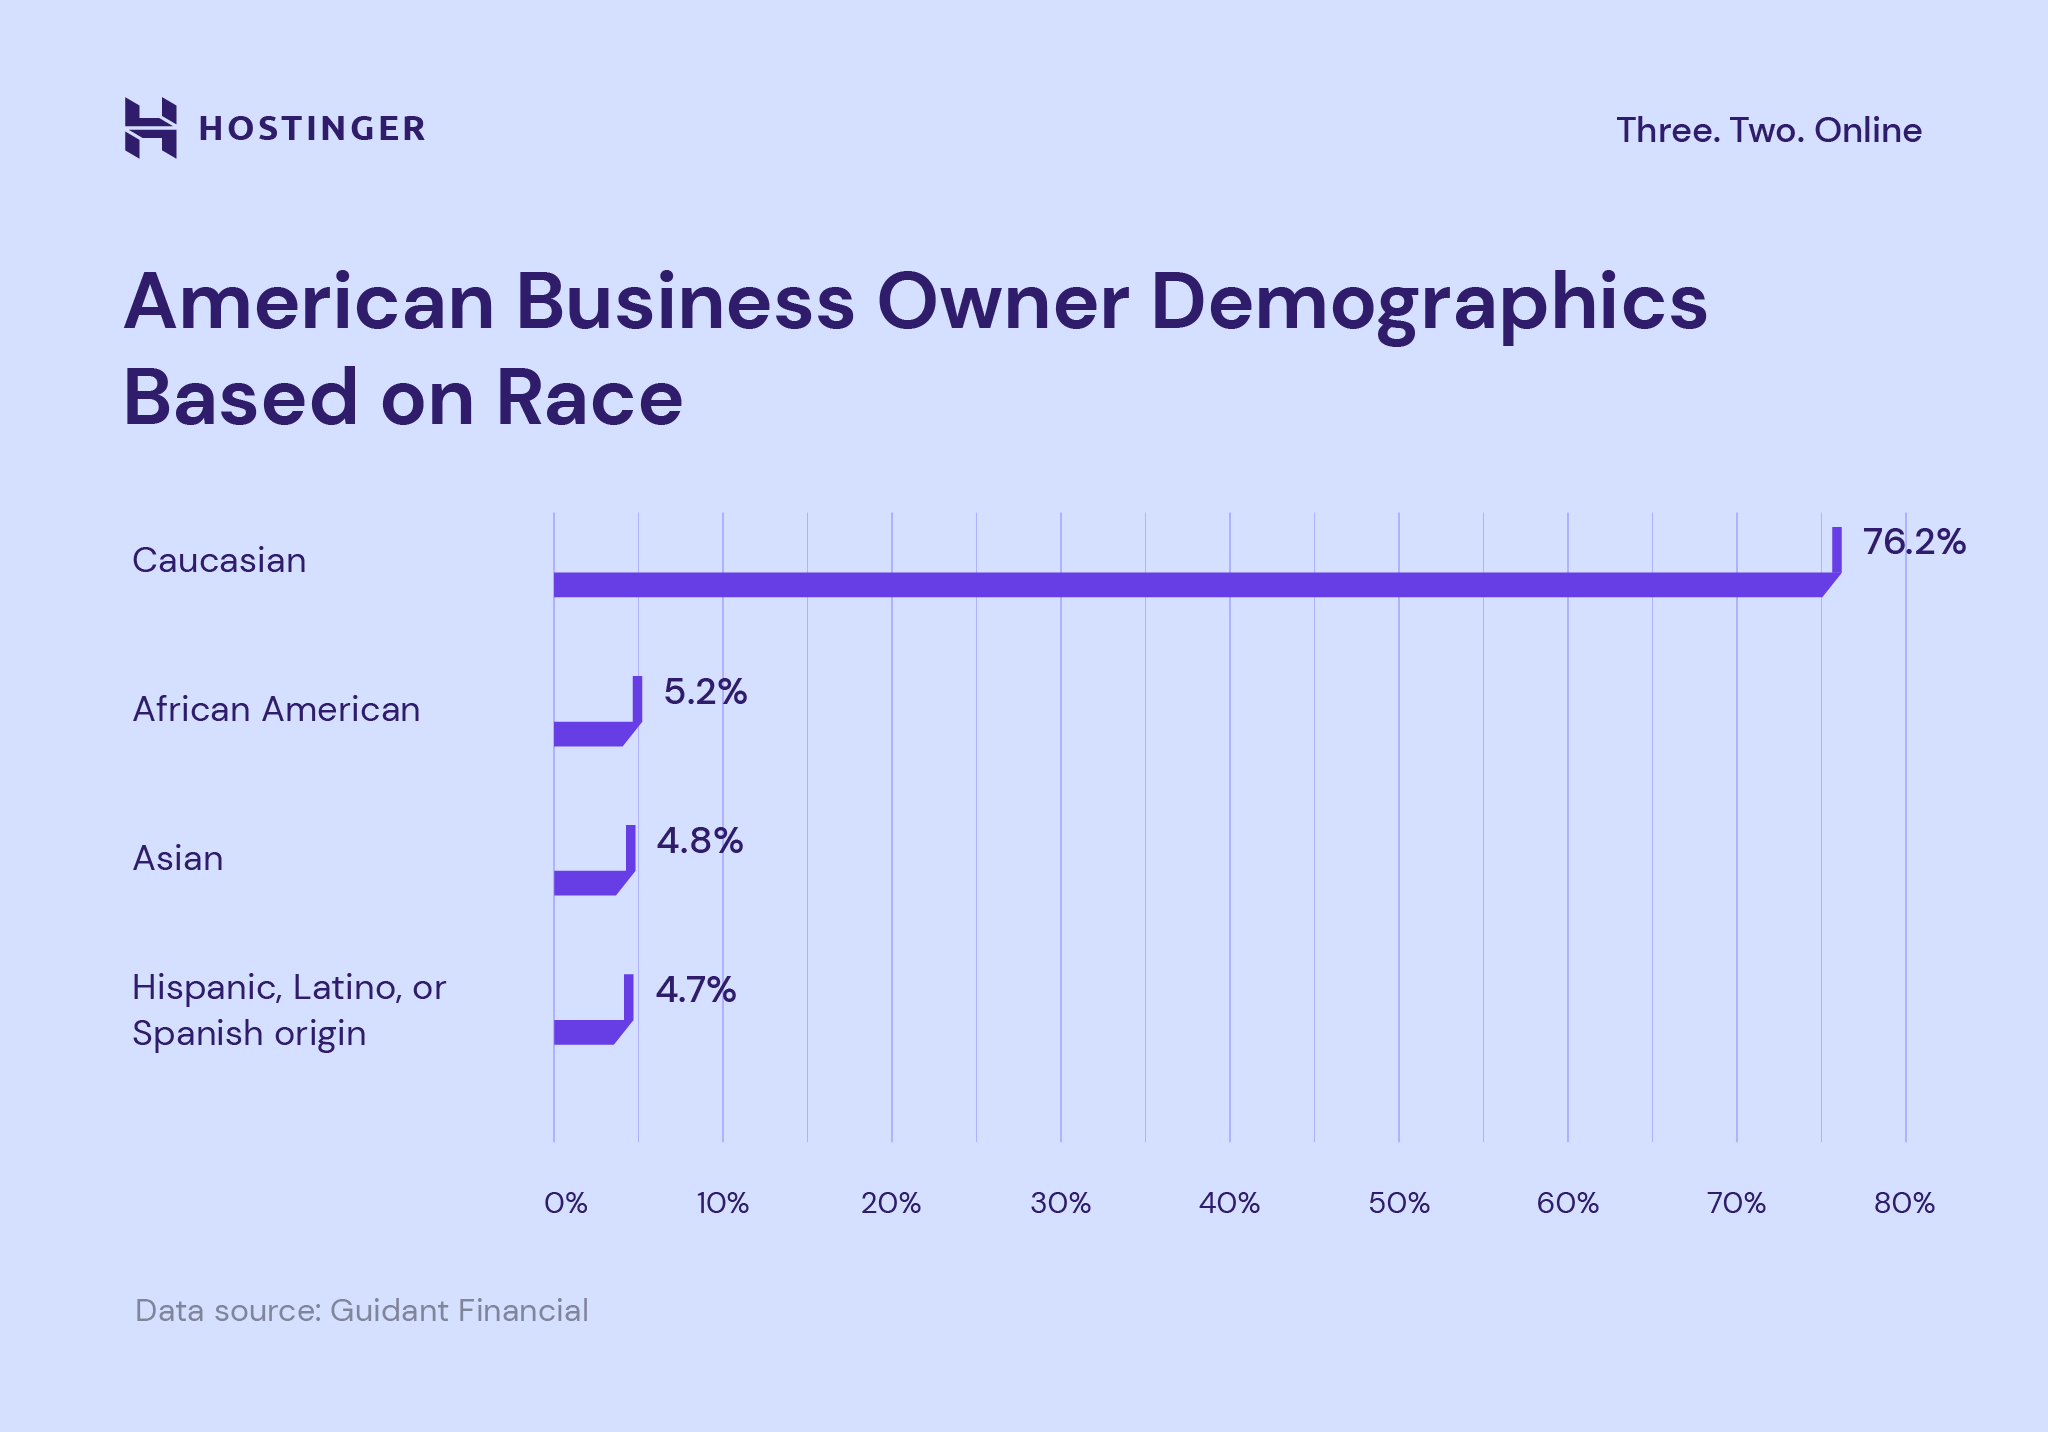
76.2% of US business owners are Caucasian, followed by African American (5.2%) and Asian (4.8%). Meanwhile, Hispanic-owned businesses make up 4.7% of the total number.
While there’s still a significant gap, the percentage of minority-owned small businesses is growing at a rapid pace.
According to a March 2022 survey by the Kauffman Foundation, there were 580 new immigrant entrepreneurs out of every 100,000 adults, compared to only 320 for native-born individuals.
Businesses owned by immigrants were particularly prominent in accommodation services, food and beverages, and retail businesses.
Digital Transformation of Small Business Statistics
More and more businesses have realized the full potential of online and digital channels in expanding their market reach.
To help you capitalize on this eCommerce trend, we’ve compiled five impactful eCommerce statistics that you should know.
23. Online Shopping Will Become the Norm
eCommerce’s market share in global retail sales reached 18.9% in 2022. This figure is projected to hit 23% by 2027.
With 28% of the global population turning to online shopping, customers expect small businesses to have an eCommerce presence to support online transactions.
This trend is likely to continue in the years to come. Therefore, it is crucial for small businesses to build a website.
24. 87% of Small Business Owners Intend to Create a Website
27% of small businesses don’t have a website yet, but the vast majority of them (87%) are planning to create one in the near future.
While it’s true that you can build a successful business without a website, having one allows you to establish a strong online presence and attract customers from all around the world.
In fact, 47% of shoppers will research your website and check its credibility before buying your products or services.
25. Artificial Intelligence Is Growing in Popularity
The global use of artificial intelligence (AI) is projected to grow by 37% every year from 2023 to 2030, according to the latest AI statistics.
25% of companies use AI to address labor shortages, while 33% find the technology helpful in automating IT processes, including data management and cyber security.
AI users will keep growing, as most businesses believe this technology can help boost employee productivity and lower operating costs.
26. Nine Out of Ten Consumers Conduct Online Research Before Buying
Around 89% of customers read online reviews before making a purchase. This is especially the case with shoppers under the age of 44.
For 41% of Americans, a positive customer review is the most important factor when browsing for local businesses.
Given these stats, it’s unsurprising that 88% of small businesses constantly monitor their brand image on social media, review sites, and Google search results.
27. Most Consumers Prefer to Shop Online
According to eCommerce statistics, more than 80% of the entire US population, or around 268 million people, buy products online.
When asked about their preferred shopping method, more than half of US consumers (55.6%) favor shopping online rather than visiting a physical store.
28. Small Businesses Embrace Technology for Survival and Growth
86% of small firm owners believe that technology helped their business survive the pandemic.
Technology platforms help entrepreneurs automate tasks, improving their business efficiency. In fact, small businesses that use more than six digital tools experienced an increase in sales, profits, and employment.
As a result, 83% of entrepreneurs will continue to make technology investments in the upcoming years, with 63% planning to implement AI and virtual reality.
Biggest Challenges for Small Business Owners
COVID-19 and the recent economic recession have affected the economic growth of various sectors worldwide. Keep reading as we uncover significant factors that impact small business success and failure rates.
29. COVID-19 Has Negatively Impacted Small Business Firms
The pandemic caused significant negative effects on 21.6% of small businesses, especially those in the accommodations and food service. Other impacted sectors include arts and entertainment, education, manufacturing, health care, and retail trade.
30. Only 34.4% of Small Companies Survive for at Least 10 Years
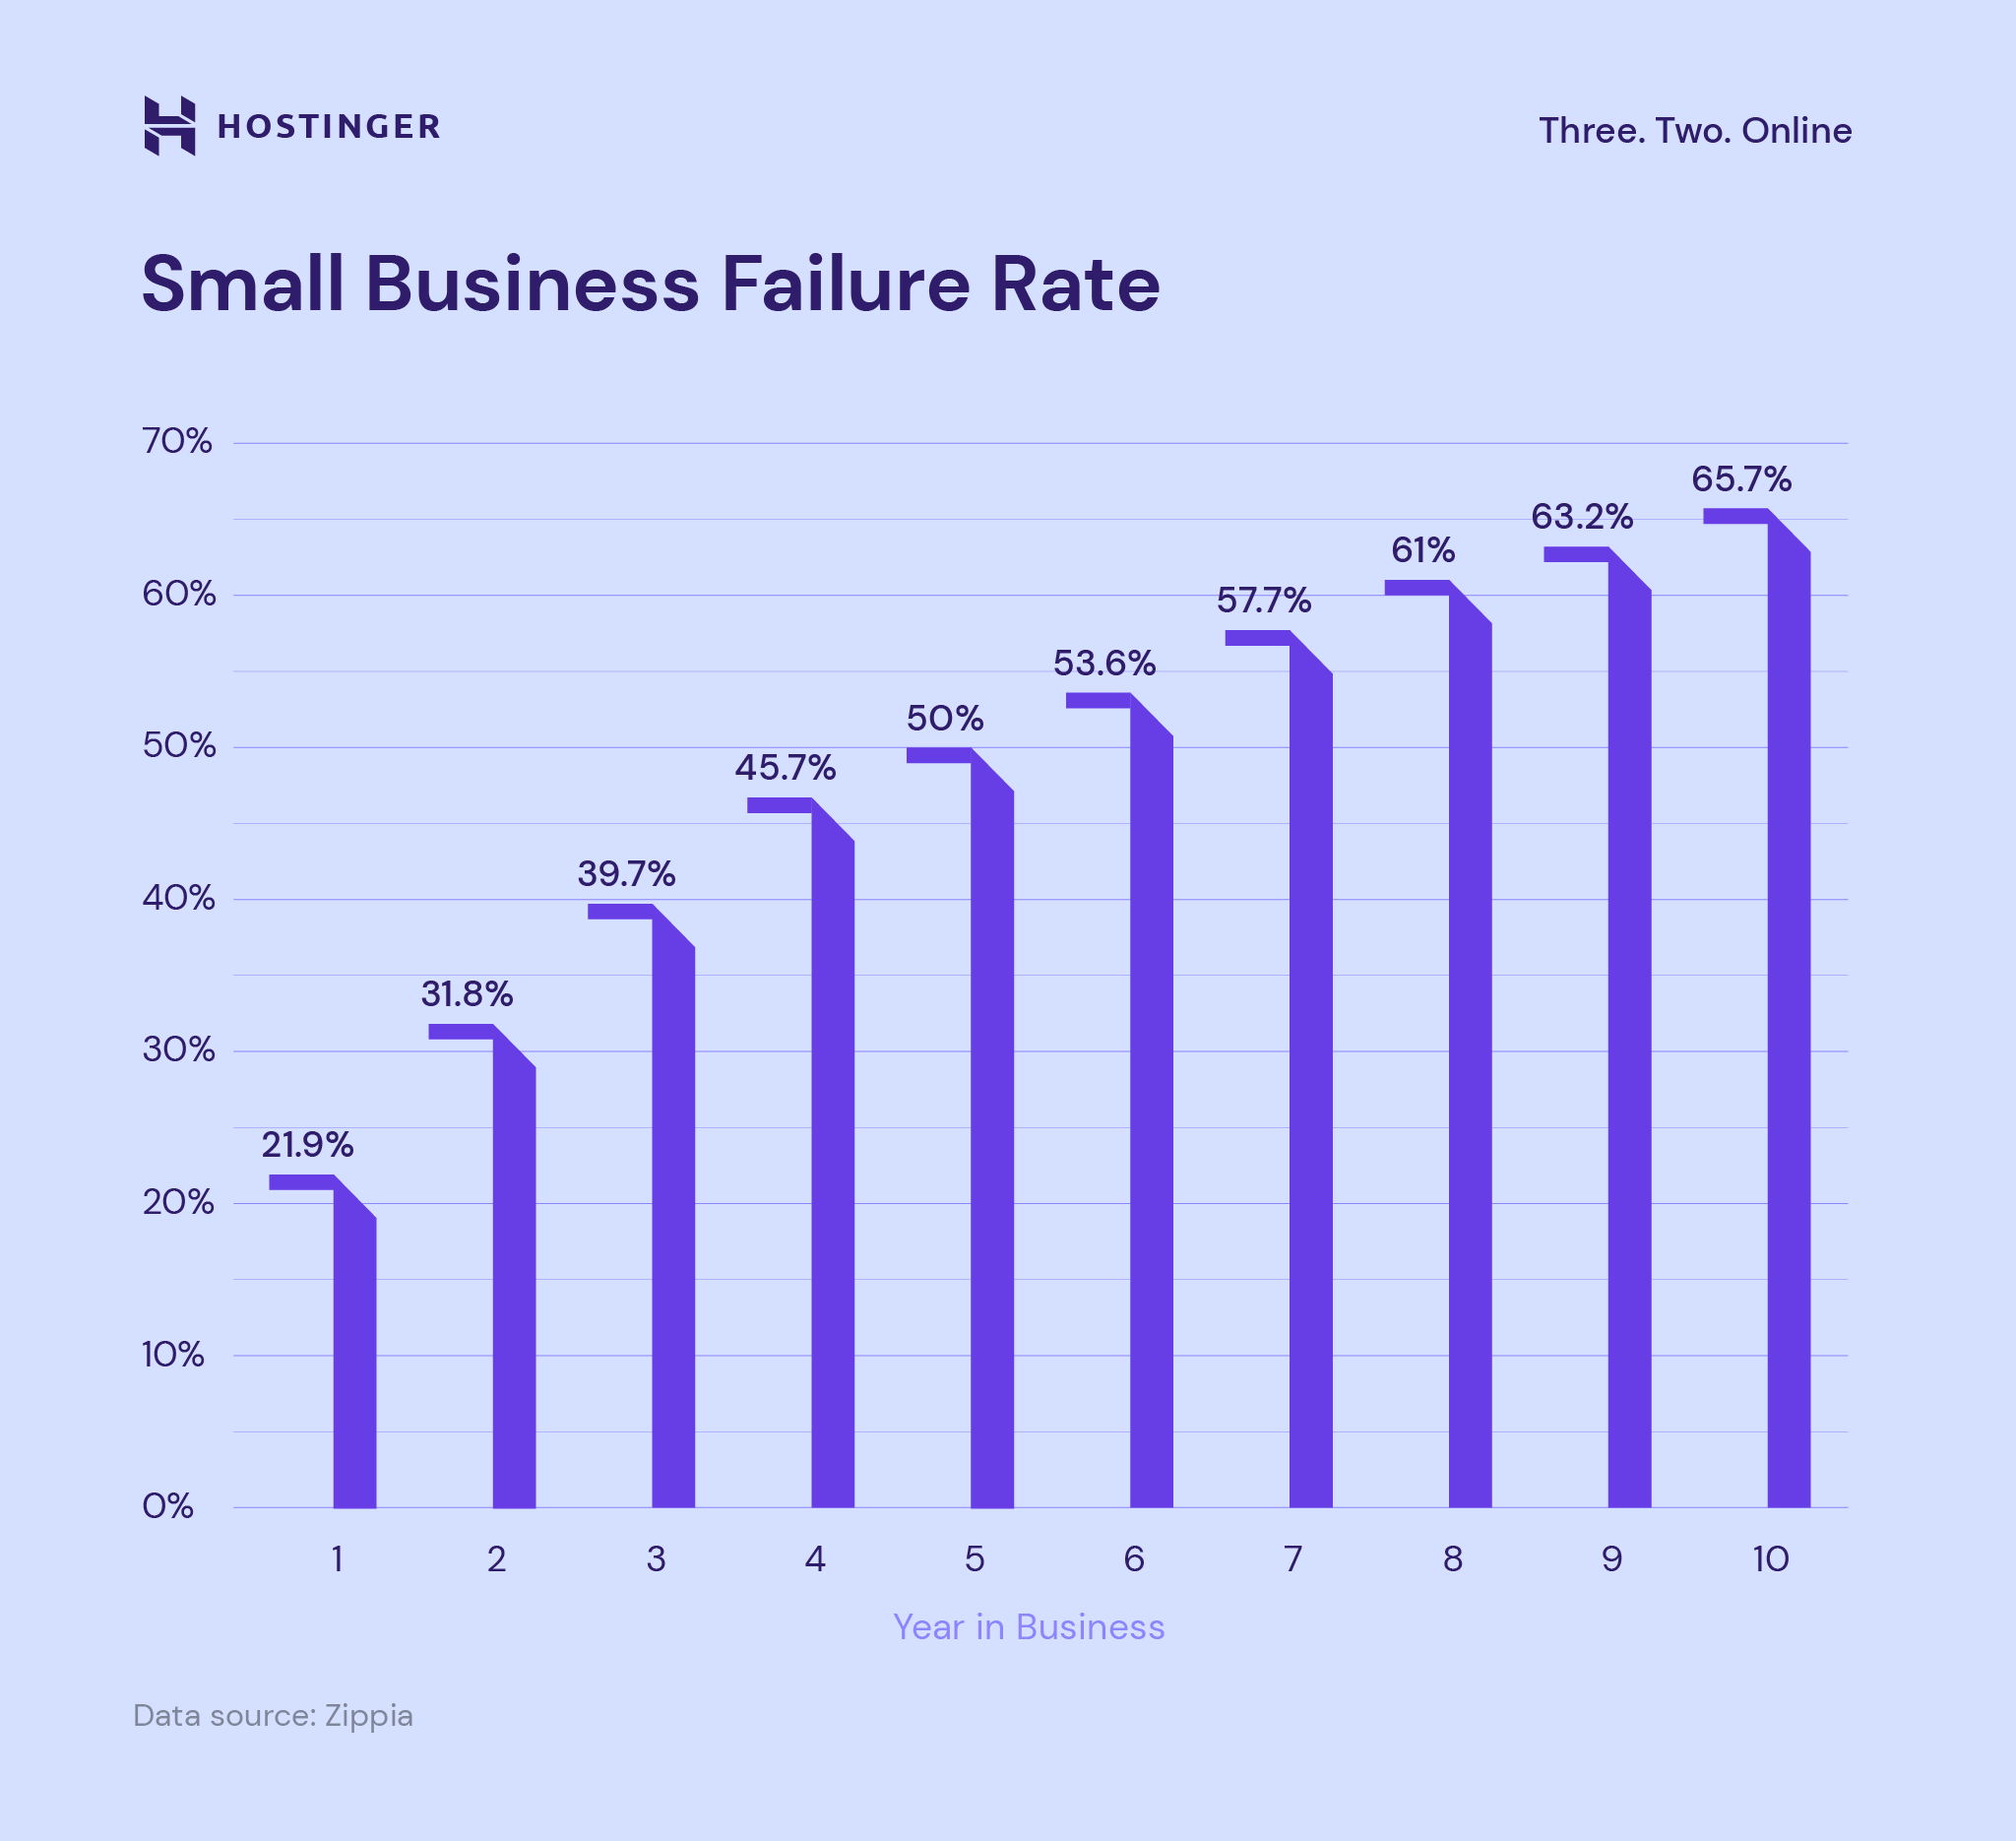
21.9% of new businesses fail within the first year, and the number increases to 50% by the fifth year. Only 34.4% of small companies survive for at least 10 years.
82% of failed small businesses experienced cash flow problems, while 42% found a lack of demand for their product or service. Other causes of failure include running out of cash (29%), not having the right team (23%), and the inability to beat competitors (19%).
31. Small Businesses Are Susceptible to Cyber Attacks
43% of cyber attacks target small businesses, but only 14% are ready to defend themselves.
The most common types of attacks include phishing (57%), compromised or stolen devices (33%), and credential theft (30%).
These cyber incidents can lead to operational disruption, financial loss, reputation damage, and legal liability.
32. Factors That Hinder the Growth of Small Businesses
Employee recruitment and retention (22%) and inflation (22%) are the most common challenges small businesses face today.
Other hurdles that stifle small business growth are the lack of capital (14%), supply chain issues (11%), advertising (8%), and administrative work (7%).
Sources
- US Small Business Administration Office of Advocacy
- Fit Small Business
- Sprout Social
- Embroker
- Zippia
- US Chamber of Commerce
- Swoop
- Findstack
- PR Newswire
- Oberlo
- Bipartisan Policy Center
- Payscale
- Guidant
- Forbes Advisor
- Paycor
- CorpNet
- Score
- DemandSage
- FED Small Business
Conclusion
It takes time, hard work, and dedication to create successful small businesses.
Fortunately, with the right blend of skills, passion, and extensive knowledge of current trends, any aspiring entrepreneur can start and grow their own venture.
We hope the small business statistics in this article have provided the data you need to launch a company and make money online.
If you have more questions, check out our FAQ section or leave a comment below.
Small Business Statistics FAQ
Find answers to commonly asked questions about small business statistics.
How Many Small Businesses Fail?
Unfortunately, almost 22% of small businesses fail within the first year, and 50% cease operations by the fifth year. Only 34.4% of small companies survive for 10 years or more.
What Small Businesses Are the Most Profitable?
Starting an online business is one of the most lucrative business options. It requires low initial investment while also offering unlimited income possibilities. You can work from the comfort of your home without worrying about store rent or maintenance costs.
Profitable online business ideas include opening a cleaning service, private tutoring, social media management, web development, or bookkeeping business.
How Much Money Do Small Businesses Make?
The average annual revenue for non-employer small businesses is around $44,000. The number skyrockets to about $1 million/year for establishments with at least five to nine employees.
What Is the Average Number of Employees in a Small Business?
In most cases, family-owned businesses employ 10 people per company. Meanwhile, non-family firms hire fewer employees, averaging eight people per business.
What Is the Success Rate of Small Businesses?
According to small business failure statistics, only 25% of startups make it to at least 15 years. Sectors with the best survival chances in the business world are real estate, agriculture, and retail.
To boost your small business’ success rate, building a strong and memorable brand identity is crucial.

Jordana is a Senior Content Writer at Hostinger with a background in Information Systems. She has over five years of experience in WordPress and is casually dabbling with PHP and MySQL. Her passion for writing and technology drives her to create tutorials for anyone wanting to build their online presence. Follow her on LinkedIn.

Brian is a Content Writer who loves telling complex stories in a simple way. He has written all types of content, including tutorials, blog posts, landing pages, social media posts, white papers, infographics, and YouTube scripts. Follow him on LinkedIn.